No significant long-term change in smartphone-tracking indicators can be detected since the Los Angeles Mayor’s order of December 2 or the California public health officer’s regional orders of December 3 and 6.
Figure 1 below shows the average time spent at home by smartphones located within the City of Los Angeles, within the remainder of Los Angeles County, and within Orange County before and after the issuance of city- and statewide stay-at-home orders at the beginning of December.

Mayor Eric Garcetti’s December 2 order applied only to the City of Los Angeles, which is contained within Los Angeles County. The state public health officer’s order of December 3, followed by a supplemental order on December 6, applied to the entire Southern California region, including all of Orange and Los Angeles counties. (Municipalities within Los Angeles County but outside the City of Los Angeles include the cities of Beverly Hills, West Hollywood, Pasadena, Long Beach and Santa Monica, to name a few.)
Figure 2 below shows the corresponding trends in the percentage of devices staying completely at home.
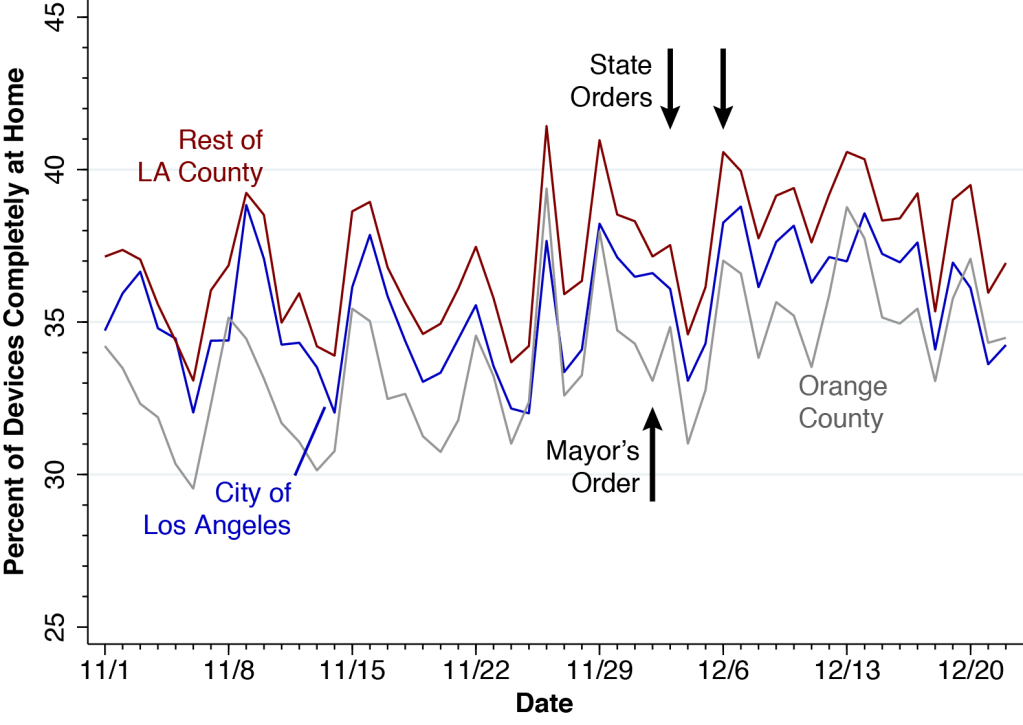
Let’s look first at the trends outside the City of Los Angeles. Comparing Sunday November 29 with the following Sunday December 6 in Figure 1, we see that the December 2 and 3 orders may have been associated with about a half-hour increase in average stay-at-home time. But this short-term effect appears to have been dissipated during the subsequent two weeks. What’s more, Figure 2 suggests that if there was indeed a decrease in social mobility in Orange County or the rest of Los Angeles County, it started before the orders were issued.
Examining the blue trend lines for the City of Los Angeles in both Figures 1 and 2, we find it even harder to discern an impact. Again, if there was indeed a small short-term effect after the orders were issued, it appears to be gone two weeks later.
These two graphs do not show impressive drops in social mobility after the city- and statewide orders. There may have been some minor short-term reductions in out-of-home movement, but they have not been persistent.
Why So Little Impact?
The December 2-6 orders did more than require people to stay at home. Mayor Garcetti’s order, for example, prohibited “all public and private gatherings of any number of people from more than one household,” except for outdoor faith-based services and outdoor protests while wearing a mask. Acting State Public Health Officer Eric Pan’s order, for example, provided that “all retailers may operate indoors at no more than 20% capacity.” Perhaps these accompanying provisions have had a favorable effect in reducing coronavirus transmission.
Still, Garcetti’s order was entitled Targeted Safer at Home Order. Right off the bat, the order reads, “Subject only to the exceptions outlined in this Order, all persons living within the City of Los Angeles are hereby ordered to remain in their homes.” Pan’s order was entitled Regional Stay At Home Order. Paragraph #2 reads, “All individuals living in the Region shall stay home or at their place of residence except as necessary to conduct activities associated with the operation, maintenance, or usage of critical infrastructure.” Yet the evidence is that residents of Los Angeles and Orange counties did not stay at home any more or less than did before these stay-at-home orders.
The reflex interpretation of these findings is that they are simply one more manifestation of COVID-19 burnout and pandemic fatigue. Our own view is that there is now a serious problem of signal versus noise.
There have been so many orders and revised orders and supplemental orders that it has become nearly impossible to ascertain what restrictions on mobility are actually in effect. If we could have performed a focused survey of public awareness or an analysis of social media content, we’d want to know how many Southern Californians were even aware that the new stay-at-home orders were in effect.
Whatever the interpretation, these findings reinforce a critical conclusion.
Los Angeles is rapidly becoming the epicenter of the United States COVID-19 pandemic. Los Angeles County authorities need to start thinking beyond their standard public health toolbox.
What used to be right is wrong.
Technical Details
Our calculations are derived from the SafeGraph Social Distancing database, which follows the GPS pings of an anonymous panel of smartphones equipped with location-tracking software. Each mobile device is assigned a home or origin based on the census block group (CBG) where it commonly spends the night. All CBG codes in Orange County begin with the 6-character string 06059, while all CBG codes in Los Angeles County begin with the 6-character code 06037. For example, the CBG codes for the three census block groups within census tract 1011.10 in the City of Los Angeles would be: 060371011101, 060371011102, and 060371011103. We can thus use census tracts to distinguish CBGs belonging to the City of Los Angeles from other municipalities within Los Angeles County.
For each calendar day from November 1 through December 22 and each CBG in Los Angeles and Orange counties, we extracted a record showing the total number of devices (device_count), the number of devices staying completely at home (completely_home_device_count), and the mean in-home dwell time (mean_home_dwell_time). For each calendar date and each of the three major geographic subdivisions (City of Los Angeles, rest of Los Angeles County, Orange County), we computed the overall mean time staying at home (Figure 1) and the overall percentage of devices staying completely at home (Figure 2).
