Corrected for reporting delays, the daily incidence of newly confirmed cases appears to have doubled.

As noted in COVID-19 Reporting Delays: Whither New York City?, we’ve been following the daily counts of newly confirmed cases of COVID-19 as they are regularly reported by the New York City health department. As a result of delays in reporting, we’ve observed, the most recent counts routinely fall below the actual number of cases to date. In fact, the health department cautions on its COVID-19 data dashboard, “Due to delays in reporting, which can take as long as a week, recent data are incomplete.”
Using a statistical method first applied to reporting delays of AIDS cases in the 1990s and recently updated in a technical report, we have filled in the missing data and projected the actual number of cases diagnosed to date. Our statistical approach cannot predict any single individual’s pending test result, but it can give us a reasonably accurate estimate of recent, new COVID-19 cases at the population level.
In Figure 1 above, the gray data points show the numbers of cases so far reported as diagnosed on each day from June 21 through October 2. The periodic dips in the data arise from reduced testing over the weekends. As a result of reporting delays, the most recent gray data points give the false impression that the epidemic has petered out. The pink data points show that, once all the case reports come in, the number of cases is expected to be at least double – if not triple – the approximately 300 cases per day seen during the past 2–3 months.
Reduced Reporting Delays, But Still Not Enough

Figure 2 shows the updated cumulative distribution of reporting delays, based on data over the most recent two months. These new data show a significant reduction in reporting times. When we last checked on August 15, only 81.3 percent of test results had been reported by 10 days, compared to 96.6 percent during the last two months. The mean reporting time is now 3.44 days, compared to 5.43 days as of August 15.
The problem, however, is that by just two days after testing, only 47.2 percent of the results – less than half – are reported. When it comes to a rapid public health response to an outbreak, two days can be an eternity. As of our cutoff date of October 2, the health department reported that 353 newly confirmed cases had been diagnosed two days earlier on September 30. That would mean 353 ÷ 47.2% = 748 cases will eventually be reported for September 30. This projection has been marked by the arrow in the upper right corner of Figure 1.
Why Our Projections Might Be Wrong
The main reason why our projections could be wrong is that the health department has abruptly reduced its reporting delays, but this improvement is not captured in our analysis of its reporting patterns during the past two months. The most likely possibility would be a substantial, recent increase in the demand for rapid testing, perhaps related to the recent reopening of schools. Thus far, we cannot find any data to support this speculation.
Nonetheless, the increase projected in Figure 1 is so substantial that we think it’s appropriate now to post our findings. When we add up the projected counts over the past 10 days, we’re talking about 2,500 excess cases above baseline.
What Might Be Happening
Alarms have been raised about newly emerging foci of infection in Brooklyn and Queens. The new data, however, suggest that something else may be happening on a larger scale.
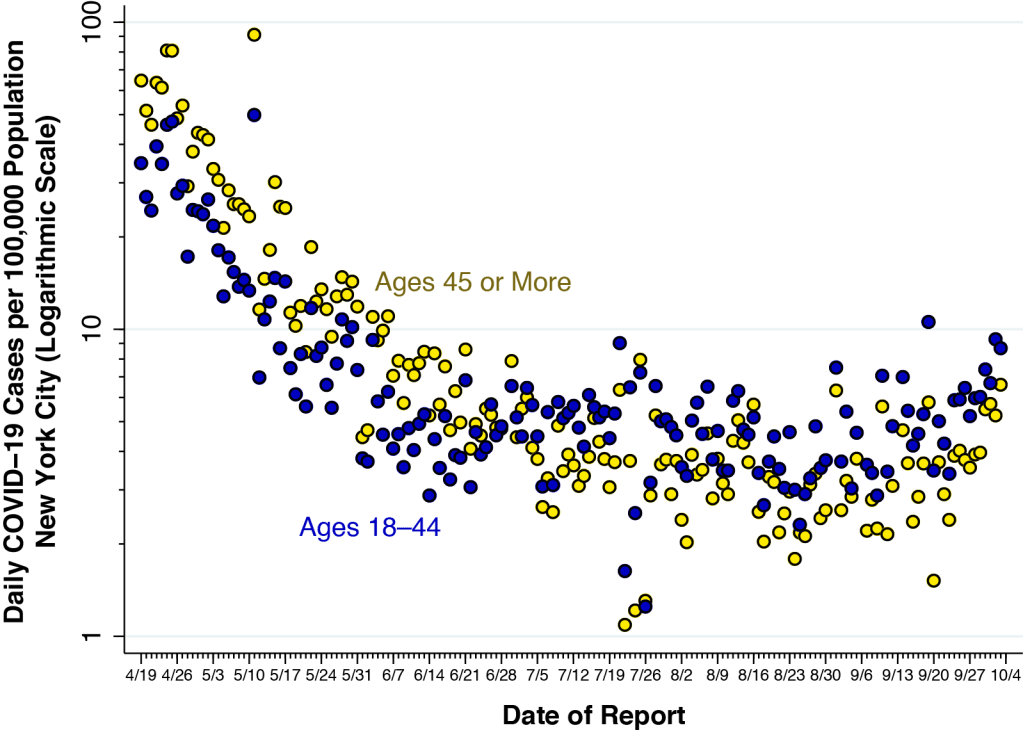
Figure 3 is an update of a graphic we’ve already displayed, but now with two more months of data. This figure does not incorporate any of our projections. It’s simply a rendering of data buried in the health department’s archive in multiple daily files named by-age.csv. The incidence of COVID-19 in the younger adult age group, ages 18–44, has now clearly overtaken the incidence in the older group. In the period through June 20, as we previously noted, younger adults had an incidence that was on average 40 percent lower than that of their older counterparts. At our last report, the incidence among younger New Yorkers after June 20 was about 20 percent greater. Now it’s more than 30 percent greater.
This shift in age distribution is not likely to be the result of the emergence of a recent hot spot, or the reopening of schools in the last two weeks. While we have no data on the age distribution of those who fled the city when the epidemic was raging, we doubt that we’re now witnessing a novel twist on the Return of the Native.
.
