Public health policy needs to be reoriented from a focus on protecting the individual to a focus on protecting the household.
In our clinical work at a community health center here in downtown Los Angeles, the classic COVID-19 presentation is not that of a single patient, but of an entire household that has come down with the virus within the space of a few days.
With so much variability in the duration of the incubation period from infection to symptoms, it’s not terribly informative which household member happened to get sick first. But if you take a careful medical history, you’ll invariably identify a younger, socially mobile family member with few or no symptoms.
We’ve lost count how many times a fifty-something patient, struggling with body aches, loss of smell and chest tightness, expresses relief that her millennial son seems absolutely fine, even though he has been in constant, direct contact with everyone else from grandpa on down. Ironically, it is painfully clear who imported virus into the household.
Two Maps, Same County
Figure 1 below compares two maps of Los Angeles County. Each map is broken down into countywide statistical areas (CSAs), a hybrid geographic classification of independent municipalities such as the City of Beverly Hills, neighborhoods of Los Angeles such as Hollywood, and unincorporated places such as Hacienda Heights.

On the left, the CSAs are color-coded according to the age-adjusted cumulative incidence of COVID-19 per 100,000 population as of September 19, 2020, which we derived from the surveillance dashboard of the Los Angeles County Department of Public Health. On the right, the same CSAs are coded according to the proportion of households that we’ve identified as at risk for multi-generational transmission, which we derived from the 2018 public use microsample of the U.S. Census Bureau’s American Community Survey. As explained in this detailed report, we classified a household as at risk for multi-generational transmission if it had at least four persons, at least one person 18–34 years of age and another person was at least 50 years of age.
The two maps in Figure 1 show a striking concordance. Those communities with the highest prevalence of at-risk households had the highest cumulative incidence of COVID-19 infection.
Three Phases
Figure 2 below shows the weekly incidence of newly diagnosed COVID-19 cases in Los Angeles County as a whole, running from the week starting March 1 through the week starting October 4, 2020. We have divided the epidemic into three phases. During Phase I, which ran approximately through the week of April 4–10, the epidemic spread radially from initial foci of infection located in relatively affluent communities such as the Brentwood and Beverly Crest neighborhoods of Los Angeles and the City of West Hollywood.

During Phase II, which ran through about the week of July 5-11, COVID-19 incidence rose at slower rate, as COVID-19 infections became increasingly concentrated in areas at higher risk of intrahousehold transmission. Since the week starting July 12, COVID-19 incidence has been gradually declining, while cases continue to accumulate in the same areas where the prevalence of at-risk households remains higher. We can see the evolution of the epidemic from March 28 through September 19 in the color-coded animation in Figure 3 below.

Within-Household Transmission Sustained the Epidemic Even As COVID-19 Diagnoses Were Declining.
Figure 4 below shows two graphs. Both relate the cumulative incidence of COVID-19 infection on the vertical axis to the prevalence of at-risk households across some 300 CSAs in Los Angeles County, as measured on the horizontal axis.
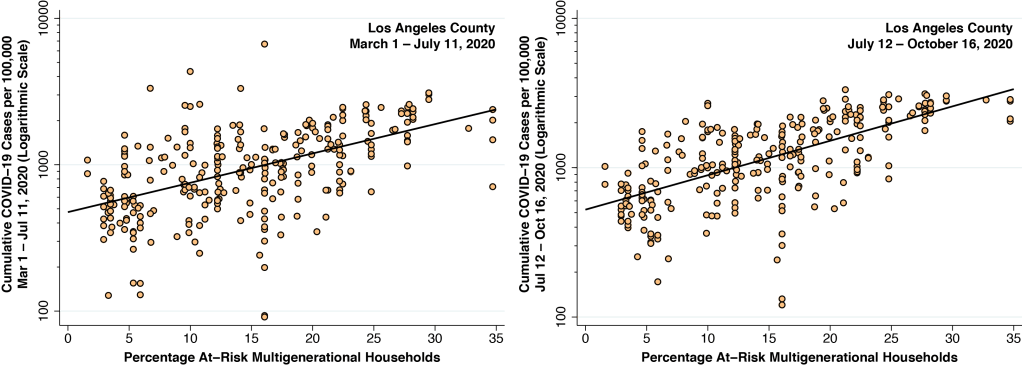
The graph on the left covers cases of COVID-19 diagnosed during Phases I and II, from March 1 through July 11, 2020, when weekly incidence rates were continuing to rise. The graph on the right, by contrast, covers cases diagnosed during Phase III, from July 12 through October 16, when weekly incidence rates have turned around and gradually begun to fall.
During Phases I and II of the epidemic through mid-summer, when weekly case counts were still rising, a 10-percentage-point increase in the prevalence of at-risk households was associated with a 46-percent increase in COVID-19 diagnoses. During Phase III when weekly case counts were declining, the same 10-percentage point increase in the prevalence of at-risk households was associated with a 53-percent increase in COVID-19 diagnoses.
Even as new COVID-19 cases were coming back down, there remained a strong relationship between COVID-19 incidence and the prevalence of at-risk households. In fact, the relationship got stronger. Even as more stringent social distancing measures took effect and the governor launched a wear-a-mask campaign in early July, the epidemic was sustained in Los Angeles County by continued within-household transmission.
Synergy
Figure 5 below maps relative gym attendance during the month of April 2020. As described in our detailed report, we used the SafeGraph Patterns Data on the movements of devices with location-tracking software to count monthly visits to any one of two thousand gyms in relation to the geographic home base of each device. Each CSA is color-coded according to its gym attendance in April 2020 – the month with the largest overall decline in gym visits – as a percentage of the CSA’s baseline gym attendance rate in February 2020.

The gym-attendance map in Figure 5 certainly doesn’t look like the cumulative incidence maps in Figures 1 and 3. While social distancing may still be an important determinant of the overall trend in COVID-19 incidence seen in Figure 2, we can’t explain differences between CSAs solely on the basis of gym attendance. It turns out, however, that the strong relationship between at-risk household prevalence and COVID-19 incidence, seen in Figure 4, is even stronger among those CSAs with higher gym attendance. That is, there appears to be a synergy between the rate of gym attendance and the prevalence of at-risk households in determining COVID-19 case counts.
The story underlying this synergy is straightforward. Gym attendance is an indicator of social mobility of younger persons. Higher social mobility means a higher risk of contracting COVID-19. When a younger person, having contracted COVID-19 outside the household, brings his or her infection back home, the impact is magnified by the presence of cohabitants of multiple generations.
A Skeptical Note on Selective Social Distancing Policies
Our findings cast a pessimistic shadow on proposed policies to selectively relax restrictions on lower-risk, younger persons while seeking to protect more vulnerable older persons. Variously labeled targeted social distancing, age-specific deconfinement and focused protection, such policies have received serious attention from social scientists, public health specialists, mathematical modelers and bioethicists. Selective social distancing is also a central element of the recently promulgated Great Barrington Declaration.
Things would be a lot simpler if older persons were all sequestered in retirement communities or assisted living facilities. But the data here demonstrate that this is not the reality of Los Angeles County. The overall, countywide prevalence of at-risk households is 13.8 percent. With an estimated 3.3 million households in the county, we’re talking about 455,000 multi-generation households where an asymptomatic or mild SARS-CoV-2 infection in a younger household member would put older household members at significant risk.
A New Focus for Public Health Policy
Our findings require us to view the household rather than the individual as the foremost target of healthcare policy. The message “protect yourself” (protégete in Spanish) needs to be reconfigured as “protect your family” (protege a tu familia). Protecting your family is a far more immediate and personal concept than “protecting others” (proteger a los demás).
When a healthcare provider encounters a new patient with suspected or established COVID-19, the clinical interview needs to turn quickly to questions about other household members. “Who do you live with?” “Is anyone else sick?” “How old are they?” “Do they have other medical problems?” “Do they have their own doctor? Or a health plan?” The widely recognized model of the patient-centered medical home needs to be replaced by the family- and household-centered medical home.
