Hospital ED visits for COVID-19 are a more informative indicator of disease burden than total reported cases.

The above animation shows the evolution of emergency department visits for COVID-19 during five successive weeks, from the week ending 12/3/21 to the week ending 12/31/21. Each data point represents one hospital, and its size reflects the number of reported ED visits.
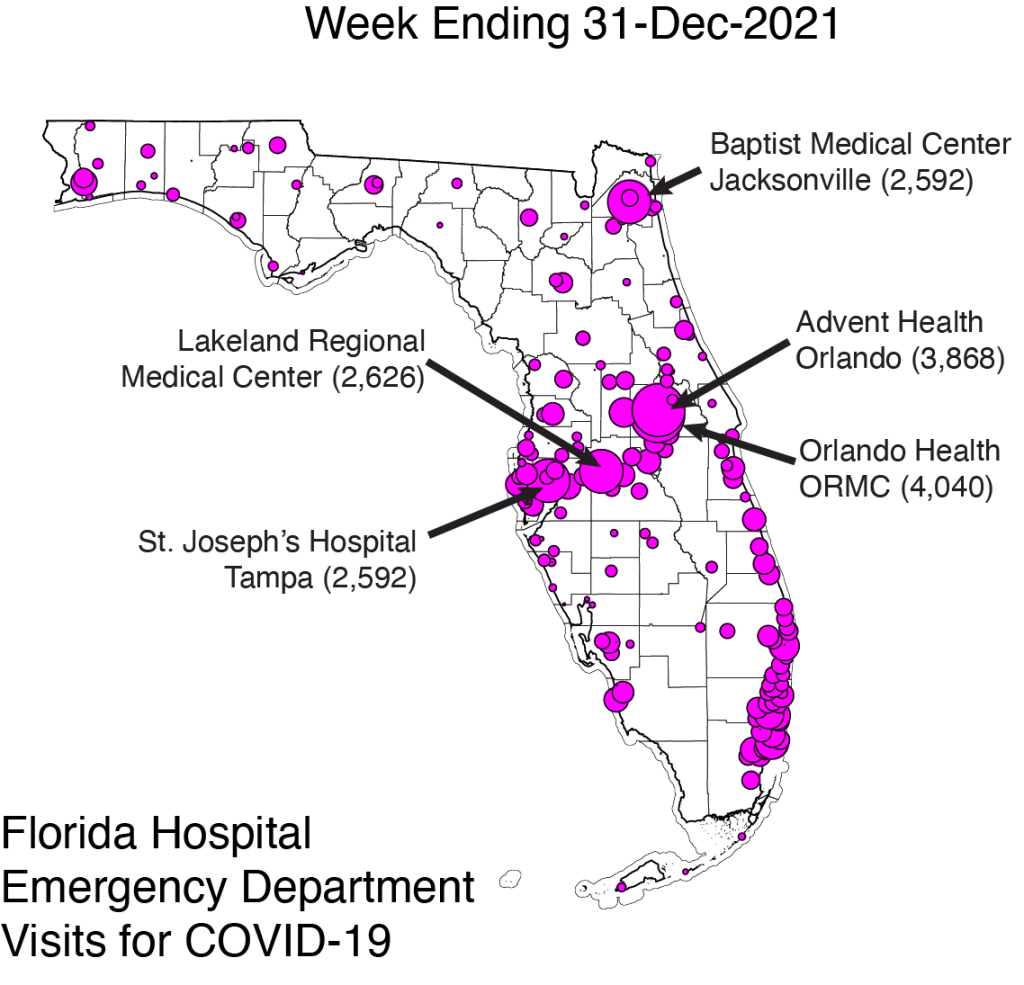
The map above is an annotated version of the last frame of the animation, corresponding to ED visit for COVID-19 during week ending 12/31/21. Specifically indicated are the five hospitals with the highest number of ED visits.
Hospital ED visits for COVID-19 approached 75,000 during the week ending 12/31/21, overtaking the Delta peak of 62,100 during the week ending 8/13/21.
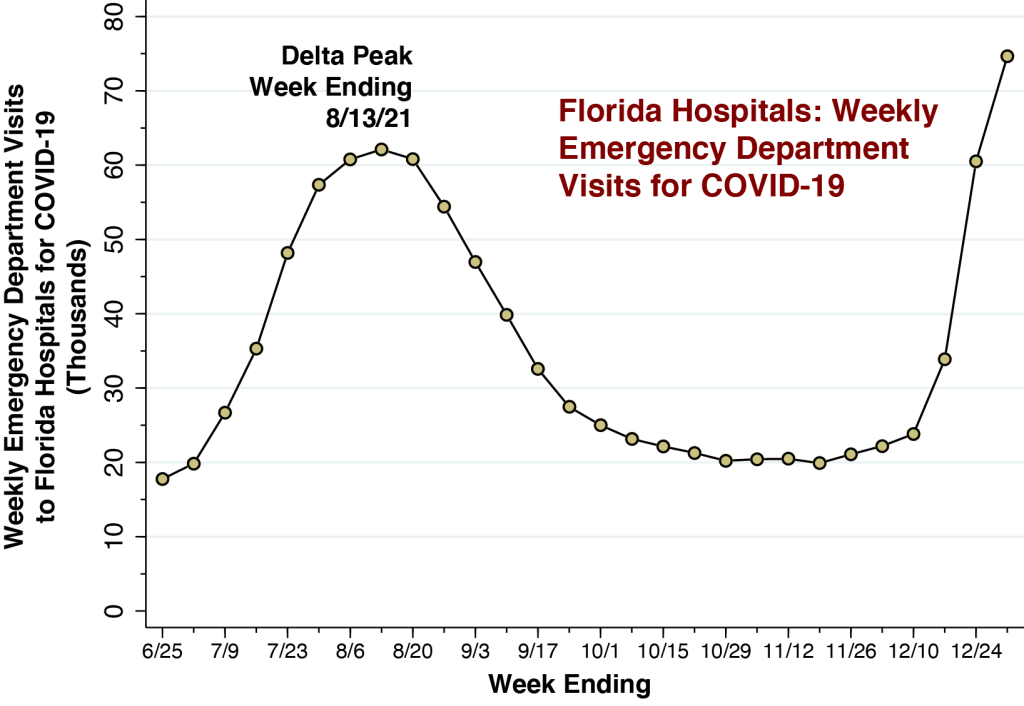
The graph above charts ED visits to Florida hospitals for COVID-19 for each week from the week ending 6/25/21 through the week ending 12/31/21. We see a marked surge during December with the emergence of the Omicron variant. The total volume of 74,660 ED visits for COVID-19 during the week ending 12/31/21 has surpassed the peak volume of 60,777 ED visits attained during the Delta wave of last summer.
For every 100 ED visits for COVID-19, there are now 15 hospital admissions.

This graph shows the number of hospital admissions for COVID-19 per 100 ED visits for COVID-19. As discussed in an earlier article, we regard this ratio as one indicator of disease severity. While the week ending 12/31/21 saw 15.5 hospital admissions for COVID-19 per 100 ED visits, this indicator remains below the peak of 25.0 admissions per 100 ED visits seen for the week ending 8/13/21 during the Delta wave.
Why ED Visits Are a More Informative Indicator Than Total Reported COVID-19 Cases
The widespread use of home-based rapid tests has raised doubts about the adequacy of publicly reported case counts. There is a growing sentiment that we need new sentinel indicators of disease burden. Emergency department visits may be just the indicator we’re looking for.
When it comes to the detailed geography of COVID-19 spread throughout the state, our maps of hospital-specific ED visit volume are more informative than the coarse, county-based maps that are frequently posted.
What’s more, the under-reporting bias in case-based indicators of COVID-19 burden has become increasingly correlated with income. As the demand for rapid home-based tests expands in the face of a limited supply, the market price of a rapid tests rises. As the market price continues to rise, rapid tests become a luxury good. They are consumed disproportionately by higher income consumers. That means those areas with higher incomes will suffer from even more under-counting.
As an indicator of the evolution of Omicron in the state, ED visits for COVID-19 do have their own potential biases. Florida has a notably high concentration of uninsured individuals, who may preferentially seek the ED simply to get tested. Large hospitals with emergency departments may serve wide geographic areas. Residents from outside Orange County may travel to the two Orlando-based hospital EDs identified in our map.
Still, emergency department visits quite likely track cases of Omicron infection that are more severe than the self-limited syndrome of sore throat, stuff nose, headache, fever, chills, body aches and fatigue. At the very least, they capture patients who are more seriously concerned about their symptoms.
Technical Notes
The data were derived from COVID-19 Reported Patient Impact and Hospital Capacity by Facility, posted by the U.S. Department of Health and Human Services (HHS). The database is updated weekly. The most recent update, on which this article is based, covers the week ending 12/31/21. An obvious disadvantage of this data source is the 11-day lag between the end of the reporting period and the date of posting.
The data on emergency department visits for COVID-19 are based upon the variable previous_day_covid_ED_visits_7_day_sum, defined as “Sum of total number of ED visits who were seen on the previous calendar day who had a visit related to COVID-19 (meets suspected or confirmed definition or presents for COVID diagnostic testing – do not count patients who present for pre-procedure screening) reported in 7-day period.”
We calculated hospital admissions for COVID-19 as the sum of two variables:
- previous_day_admission_adult_covid_confirmed_7_day_sum, defined as “Sum of number of patients who were admitted to an adult inpatient bed on the previous calendar day who had confirmed COVID-19 at the time of admission reported in the 7-day period.”
- previous_day_admission_pediatric_covid_confirmed_7_day_sum, defined as “Sum of number of pediatric patients who were admitted to an inpatient bed, including NICU, PICU, newborn, and nursery, on the previous calendar day who had confirmed COVID-19 at the time of admission.”
Both of these definitions are confined to admitted patients who were diagnosed with confirmed COVID-19 at the time of admission, and thus tend to attenuate the potential problem of so-called incidental admissions.
The maps were based upon the geocodes (longitude and latitude) of each hospital, which were already included in the HHS database. We relied on the Texas A&M interactive geocoding website to fill in the missing geocodes for 18 hospitals. The size of each point was based upon the weighting scheme built into the Stata scatter command.
