During the week ending December 17, emergency department visits for COVID-19 rose by 12.8%, while hospital admissions rose by 16.5%. There are now 6.2 hospital admissions per 100 ED visits for COVID-19. The evidence does not paint a reassuring picture of generally benign disease.

Following a Cohort of 250 High-Volume Hospitals
Numerous sources confirm that the incidence of newly diagnosed COVID-19 cases has been rising precipitously in the United States during the past three weeks. The more pressing issue, however, is the composition and severity of those cases.
To address this critical question, we are following a cohort of 250 high-volume hospitals located in 164 counties throughout the U.S. Our focus on a cohort of hospitals known to have treated large numbers of COVID-19 patients avoids problems of sampling variability and inconsistent reporting among smaller, lower-volume hospitals.
ED Visits for COVID-19 Increased by 12.8% During the Past Week.
For this 250-hospital cohort as a whole, we’ve relied on weekly reports from the U.S. Department of Health and Human Services to compute total emergency department visits for COVID-19 and total adult and pediatric hospital admissions for confirmed COVID-19. The admissions data exclude cases of patients who were admitted for other reasons and subsequently found to be infected.
In our 250 sentinel hospital cohort, Fig. 1 above shows that weekly ED visits for COVID-19 increased by 12.8% from 132,743 during the week ending December 10 to 149,798 during the week ending December 17, 2021. ED visits for COVID-19 are now approaching the peak of 158,150 reported for the week ending August 20 during the Delta wave.
Hospital Admissions for COVID-19 Have Risen to 6.2 per 100 ED Visits.
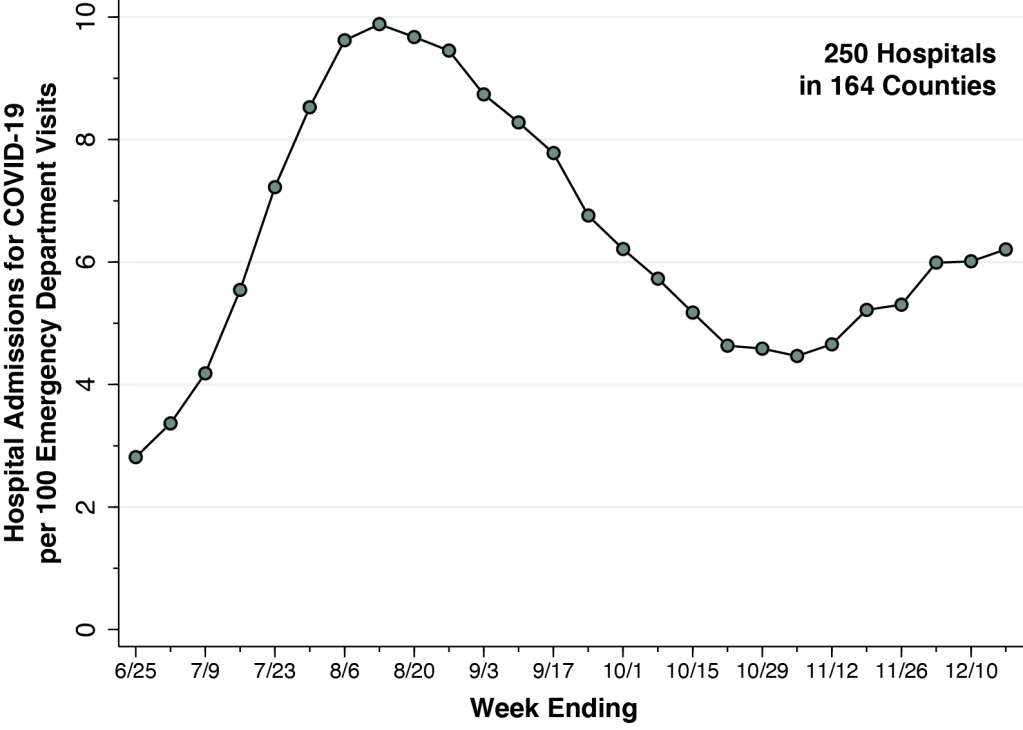
Within our 250-hospital cohort, admissions for COVID-19 have been rising somewhat faster than ED visits. While ED visits rose by 12.8% during the most recent week, hospital admissions rose by 16.5%. As shown in Fig. 2 above, hospital admissions now stand at 6.2 per 100 ED visits. While admissions per 100 ED visits are continuing to rise, Fig. 2 shows that this indicator remains below its peak of 9.9 attained during the week ending August 13.
What Do These Results Imply About Omicron-Related Case Severity ?
Tracking hospital admissions per 100 ED visits is obviously a more informative means of assessing Omicron-related case severity than comparing current admission rates to historical controls. Virtually all patients admitted with COVID-19 pneumonia and other acute complications come through the hospital’s emergency department.
Patients who present to the ED with COVID-19 symptoms are a self-triaged population. The symptoms motivating them to seek emergency care now may have changed from those bringing them to the ED last summer. Criteria for admitting patients may also have changed, especially if hospital resources are more constrained, as we have recently reported.
Still, the data in Figs. 1 and 2 hardly communicate the reassuring picture of a generally benign disease. To be sure, the current rate of 6.2 admissions per 100 ED visits is still about 27 percent below the peak of 9.9 during the Delta wave. Only time will tell, however, how high this indicator will continue to rise.
And as many observers have already pointed out, the sheer volume of new cases may be enough to bring our healthcare system to its knees.
Sentinel Hospital Cohort

