Critical Staffing Shortages in U.S. Hospitals Continue to Rise

Nearly one in four hospital beds is now located in a hospital reporting a critical staffing shortage.

We analyzed all U.S. hospitals reported by the Department of Health and Human Services. (HHS) The data, originally reported on a daily basis, are aggregated by week. The percentages of all reporting hospitals in each state are weighted by their inpatient bed capacity. HHS appears to rely on each hospital’s self-report of a critical staffing shortage.

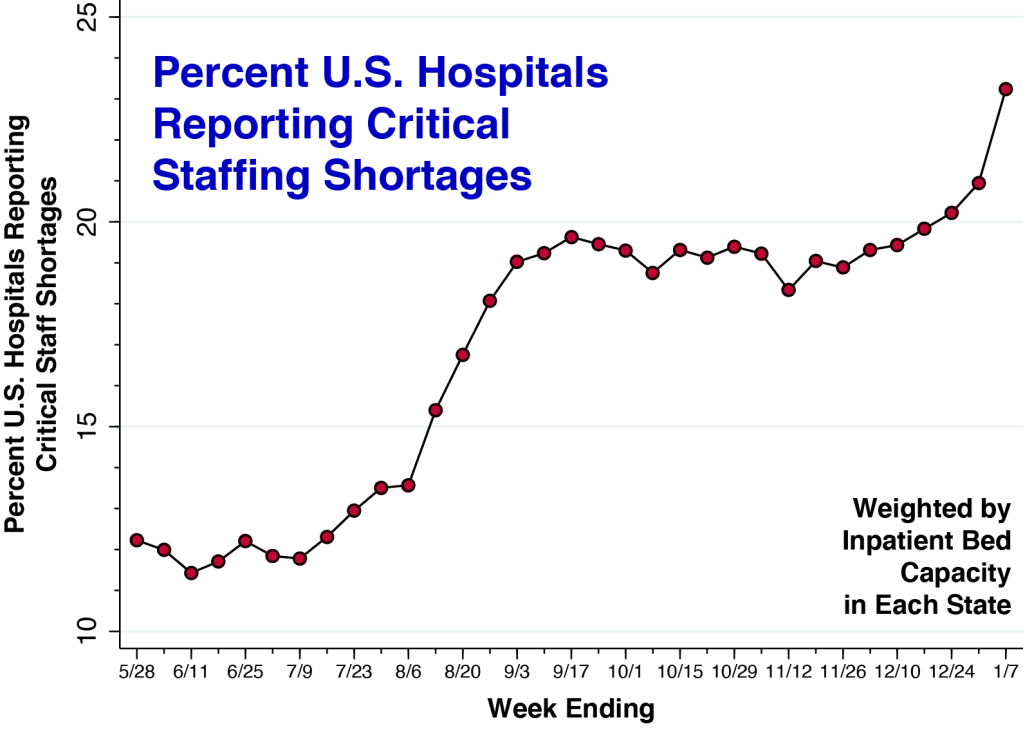
This post continues to update our earlier summary of trends in U.S. hospital staffing. During the Delta wave in the United States, the percentage of hospitals reporting critical staffing shortages rose from 12 to 19 percent. Even as hospital admission rates declined in October and November, the critical staffing percentage remained elevated at 19 percent. Over the past four weeks, as the Omicron variant has begun to spread, this percentage has increased to 23.2 percent.

To determine each data point in the figure, we first ascertained the percentage of hospitals in each state reporting a critical staffing shortage, as reported by the Department of Health and Human Services. We then computed the weighted average across all states, where the weights were each state’s inpatient bed capacity. During the week ending January 7, 2022, we’ve thus calculated that 23.2 percent of all U.S. hospital beds were located in a hospital reporting a critical staffing shortage.

Trends in staffing shortages vary across states. Below we plot the percentage of hospitals with critical staffing shortages in two of the hardest hit states: New Mexico and Rhode Island.

Weekly percentages of hospitals reporting critical staffing shortages in New Mexico and Rhode Island from the week ending 5/28/21 to the week ending 1/7/22. Data source: HHS.

The critical staffing shortage percentage in New Mexico has increased steadily from 24.9 during the week ending May 28 to 52.3 during the most recent reporting week ending January 7. By contrast, the proportion of Rhode Island hospitals with a critical staffing shortage shot up to about 50 percent with the emergence of the Delta wave in August and has remained at that level.

Vaccine Mandates are Unlikely to be the Primary Cause.

Some have contended that vaccine mandates are contributing to the emerging shortage of healthcare workers. But there is little concrete evidence to back up this contention. While a small minority of healthcare employees have chosen to leave their jobs, the vast majority have opted for vaccine protection. At large healthcare systems like Houston Methodist, Truman Medical Centers/University Health in Kansas City, the North Carolina hospital system, Advocate Aurora Health in Chicago, Mount Sinai Health System in New York, St. Claire Regional Medical Center in Kentucky, and Henry Ford Health System in Detroit, less than 1 percent of employees have had to be let go.

The Labor Market for Skilled Nursing Care was Already Tight.

Still others have pointed to the increasing fees charged by traveling nurses and nurse staffing agencies to compensate for growing vacancies among nurse employees. The plain fact, however, is that the tight labor market for hospital-based nursing care predated the COVID-19 pandemic. Annual turnover among hospital-based registered nurses was already up to 15.9% in 2019 and increased to 18.7% in 2020.

It’s All About Pandemic Burnout.

Far and away the most critical determinant of rising staff shortages has been burnout and peritraumatic stress among healthcare workers, with more nurses leaving their employment as the pandemic drags on. While burnout among frontline healthcare workers has always been a serious problem, the percent of surveyed hospitals reporting 10% or more vacancies for RNs abruptly rose from 23.7% in 2019 to 31.8% in 2020 to 35.8% by early 2021.

The evidence of burnout among frontline workers is overwhelming not only in the U.S., but many other healthcare systems, including China during the initial Wuhan outbreak. The president of the American Nurses Association recently asked the U.S. Secretary of Health and Human Services to declare a national nursing shortage crisis. A national strategy to address healthcare worker burnout as been repeatedly urged.

We’re talking about continuous exposure to traumatic stress from extended hours, time away from family, near-continuous use of personal protective equipment, fear of personally contracting COVID-19, loss of patients with whom workers have become emotionally attached, and the rising frequency of medical errors as emergency rooms and ICUs fill up. We’re talking not only about ordinary job burnout, but also compassion burnout.

The anti-vaccination movement is driven in part by conspiracy theories that sow doubt about the integrity of medical professionals. Has the resulting loss of confidence caused some healthcare workers to experience a disconnect from their beliefs in the value of their work?

Stay Tuned.

We will continue to follow the aggregate U.S. hospital staffing situation as the Omicron wave plays out.

Florida COVID-19 Hospital Admissions Approaching This Past Summer’s Delta Peak

Daily admissions to Florida hospitals for confirmed adult and pediatric cases continue to double every 6.7 days, now at nearly three times the daily admissions registered at the same point during this past summer’s Delta wave.

We relied on data from the U.S. Department of Health and Human Services to track combined adult and pediatric hospital admissions for confirmed COVID-19 among all Florida hospitals. The horizontal time axis is measured in days from the estimated first appearance of each variant. See Technical Notes below for details.

We further update our comparison of the hospitalization curves for the Delta and Omicron waves in Florida. By day 15 from the initial appearance of each variant, statewide confirmed COVID-19 admissions among adults and children combined were running at about 250 per day. By day 36, however, Delta-wave admissions were 734, while Omicron-wave admissions have reached 2009. That’s nearly three times the number of admissions registered at the same point during this past summer’s wave.

Log-linear regressions on the data points from days 10 to 34 now give doubling times of 20.6 days for Delta and 6.72 days for Omicron. (The 95% confidence interval for the Omicron doubling time is 6.28 – 7.27 days.) As we have repeatedly stressed, these early findings do not necessarily mean that the Omicron curve will reach the Delta peak of 2,360 statewide hospital admissions attained on August 17, 2021 (that is, day 68 from initial appearance).

Hospitalization Rates Matter.

Public officials and some commentators have noted that COVID-19 hospitalization rates are not rising nearly so fast as total case counts. The fact that hospitalization-to-case ratios are now lower than during the past summer’s wave has been highlighted as favorable news. With rapid home-based COVID-19 tests now in abundance, it is unclear what case counts reported by public health departments are supposed to represent.

We continue to focus here on severe disease and its impact on our already stressed healthcare system.

Technical Notes

As we’ve repeatedly noted, we do not have data on the variant underlying each hospital admission. Still, according to the most recent CDC report on state-specific variant proportions, 82.4% of recent SARS-CoV-2 samples sequenced in the U.S. region covering Florida were attributable to the Omicron variant.

We have estimated the initial appearance of the Delta variant as June 10, 2021. There are reports that the variant was in fact detected by late May. If we translated the time axis for Delta to the right, however, the Omicron-related hospitalization curve would be running even further ahead of its predecessor.

The calculations in the figure are derived from COVID-19 Reported Patient Impact and Hospital Capacity by State Timeseries, maintained by the U.S. Department of Health and Human Services. The daily counts represent the daily sums of two variables for all Florida hospitals combined:

  • previous_day_admission_adult_covid_confirmed: Number of patients who were admitted to an adult inpatient bed on the previous calendar day who had confirmed COVID-19 at the time of admission in this state
  • previous_day_admission_pediatric_covid_confirmed: Number of pediatric patients who were admitted to an inpatient bed, including NICU, PICU, newborn, and nursery, on the previous calendar day who had confirmed COVID-19 at the time of admission in this state

Some commentators have expressed a general concern that COVID-19 hospitalization counts include patients admitted for unrelated reasons who incidentally tested positive. Since confirmation of a COVID-19 diagnosis is made by PCR test results that are not immediately available at the time of admission, it is unlikely that the calculations in our figure above suffer from such a potential bias.

We will have more to say about the issue of incidental COVID-19 hospitalizations in a future article.

Florida COVID-19 Hospital Admissions Show No Signs of Slowing, Continue to Outpace Last Summer’s Delta Wave

Daily admissions to Florida hospitals for confirmed adult and pediatric cases continue to double every 6.7 days.

We relied on data from the U.S. Department of Health and Human Services to track combined adult and pediatric hospital admissions for confirmed COVID-19 among all Florida hospitals. The horizontal time axis is measured in days from the estimated first appearance of each variant. See Technical Notes below for details.

We further update our comparison of the hospitalization curves for the Delta and Omicron waves in Florida. By day 15 from the initial appearance of each variant, statewide confirmed COVID-19 admissions among adults and children combined were running at about 250 per day. By day 34, however, Delta-wave admissions were 672, while Omicron-wave admissions have reached 1620. That’s nearly 2.5 time the number of admissions registered at the same point during this past summer’s wave.

Log-linear regressions on the data points from days 10 to 34 now give doubling times of 20.6 days for Delta and 6.71 days for Omicron. (The 95% confidence interval for the Omicron doubling time is 6.21 – 7.33 days.) As we have repeatedly stressed, these early findings do not necessarily mean that the Omicron curve will reach the Delta peak of 2,360 statewide hospital admissions attained on August 17, 2021 (that is, day 68 from initial appearance).

Hospitalization Rates Matter.

Public officials and some commentators have noted that COVID-19 hospitalization rates are not rising nearly so fast as total case counts. The fact that hospitalization-to-case ratios are now lower than during the past summer’s wave has been highlighted as favorable news. With rapid home-based COVID-19 tests now in abundance, it is unclear what case counts reported by public health departments are supposed to represent.

We continue to focus here on severe disease and its impact on our already stressed healthcare system.

Technical Notes

As we’ve repeatedly noted, we do not have data on the variant underlying each hospital admission. Still, according to the most recent CDC report on state-specific variant proportions, 82.4% of recent SARS-CoV-2 samples sequenced in the U.S. region covering Florida were attributable to the Omicron variant.

We have estimated the initial appearance of the Delta variant as June 10, 2021. There are reports that the variant was in fact detected by late May. If we translated the time axis for Delta to the right, however, the Omicron-related hospitalization curve would be running even further ahead of its predecessor.

The calculations in the figure are derived from COVID-19 Reported Patient Impact and Hospital Capacity by State Timeseries, maintained by the U.S. Department of Health and Human Services. The daily counts represent the daily sums of two variables for all Florida hospitals combined:

  • previous_day_admission_adult_covid_confirmed: Number of patients who were admitted to an adult inpatient bed on the previous calendar day who had confirmed COVID-19 at the time of admission in this state
  • previous_day_admission_pediatric_covid_confirmed: Number of pediatric patients who were admitted to an inpatient bed, including NICU, PICU, newborn, and nursery, on the previous calendar day who had confirmed COVID-19 at the time of admission in this state

Some commentators have expressed a general concern that COVID-19 hospitalization counts include patients admitted for unrelated reasons who incidentally tested positive. Since confirmation of a COVID-19 diagnosis is made by PCR test results that are not immediately available at the time of admission, it is unlikely that the calculations in our figure above suffer from such a potential bias.

If hospitals were backdating COVID-19 diagnoses to the date of admission once they received one- or two-day delayed PCR results, we would detect significant backdating through comparison of serially posted databases. During the past 10 days, we estimate that such backdating accounted for less than 4 percent of all admissions.

Omicron in Florida: Hospital Emergency Department Visits Track COVID-19 Spread

The pervasive use of home-based rapid tests has raised doubts about the adequacy of publicly reported case counts. We need new sentinel indicators of disease burden.

Fig.1. Emergency Department Visits for COVID-19 at Florida Hospitals During the Week Ending December 24, 2021. Each data point represents one hospital. Data point size indicates number of ED visits for COVID-19. The top seven hospitals by volume of COVID-19 ED visits are identified. Source: COVID-19 Reported Patient Impact and Hospital Capacity by Facility. See Technical Notes below for further details.

Fig.1 maps the number of emergency department visits for COVID-19 to 204 Florida hospitals during the week ending December 24, 2021, as reported to the U.S. Department of Health and Human Services. Each data point represents one hospital, and its size reflects the number of reported ED visits. We have specifically identified the seven hospitals with the highest volume of ED visits for COVID-19. At the head of the list was Orlando Health Orlando Regional Medical Center, located in Orange County, with 3,410 ED visits for COVID-19.

Emergency Department Visits Are Now Approaching Their Delta Peak of Last Summer.

As shown in Fig. 2 below, weekly emergency department visits to Florida hospitals – representing all of the points in Fig. 1 combined – have now reached 60,113, a level just short of the maximum of 62,109 attained during the week ending August 13 during the Delta wave.

Fig. 2. Weekly Emergency Department Visits at All Florida Hospitals. Weekly visits are tabulated from the week ending June 15 to the week ending December 24, 2021. Source: COVID-19 Reported Patient Impact and Hospital Capacity by Facility. See Technical Notes below for further details.

It’s arguable that the ED visit-based map in Fig. 1 has its own biases. Florida has a notably high concentration of uninsured individuals, who may preferentially seek the ED simply to get tested. Large hospitals with emergency departments may serve wide geographic areas. Residents from outside Orange County may travel to the two Orlando-based hospital EDs identified in our map of Fig. 1.

Still, emergency department visits quite likely track cases of Omicron infection with more than just a sore throat, fever, body aches and fatigue. They capture patients who are more seriously concerned about their symptoms. As we show in a separate article, ED visits track hospitalizations.

County-Based Maps Give a Distorted Picture.

The map in Fig. 1 above offers a much more finely detailed view of the recent spread of COVID-19 in Florida than the county-based maps that have already appeared in so many websites. Since the Florida Department of Health now reports only weekly total cases for the entire state, analysts have relied instead on the Community Profile Reports issued by the U.S. Department of Health and Human Services. In Fig. 3 below, we have constructed our own version of the county-based map, color-coded according to the number of reported cases per 100,000 population in each county.

Fig.3 Reported Confirmed COVID-19 Cases per 100,000 Population by Florida County, December 22-28, 2021. Source: U.S. Department of Health and Human Services, The 16 most populous counties are specifically identified by name. Source: Community Profile Report, December 29, 2021 . Versions of essentially the same map, based upon the same underlying data but with varying buckets of case rates, have been posted widely. (Check out visualization M2 on Jason Salemi’s comprehensive web site.)

Unfortunately, these county-level visualizations may give us a distorted picture of where COVID-19 is actually surging in Florida. One problem is wide dispersion in population denominators. The map above tells us which counties have the highest reported case rates per population, but the counties vary widely by population. A high case-to-population ratio gets a darker shade of purple even if the county has relatively few inhabitants. Monroe County at the southwest tip of the state, encompassing the Everglades, had a rate of 496 cases per 100,000 population per week and thus merits a dark purple shade on our map, but the county only had 0.29 percent of all statewide cases.

Counties Are Too Big.

What’s more, the county is far too large a geographic entity to make any real sense of what’s happening in Florida at the micro level. Broward County had a rate of 1,205 cases per 100,000 during the week of December 22-28. The map in Fig. 3 tells us that the entire 1,323 square miles of Broward County is a hot spot. But Broward contains the cities of Fort Lauderdale, Pembroke Pines, Hollywod, Miramar, and Coral Springs, each with a population exceeding 125,000. By contrast, Fig. 1 tells us that the largest concentration is in Hollywood.

Rapid Tests as Luxury Goods

But there is an even more vexing problem. The map in Fig. 3 relies on an indicator of the spread of COVID-19 that has come increasingly into question. While state and county health departments like Florida’s continue to attempt to compile all confirmed diagnoses of COVID-19, particularly those cases documented through PCR (polymerase chain reaction) testing, the recent explosion in rapid home-based tests massively exaggerates the long-standing problem of case under-ascertainment.

Now think economics. As the demand for rapid home-based tests expands in the face of a limited supply, the market price of a rapid tests rises. As the market price continues to rise, rapid tests become a luxury good. They are consumed disproportionately by higher income consumers. That means those areas with higher incomes will suffer from even more under-counting.

That’s why emergency department visits, rather than aggregate case counts, hold more promise as indicators of COVID-19 spread in the state.

Technical Notes

The data were derived from COVID-19 Reported Patient Impact and Hospital Capacity by Facility, posted by the U.S. Department of Health and Human Services (HHS). The database is updated weekly. The most recent update, on which this article is based, covers the week ending 12/24/21.

The data on emergency department visits for COVID-19 are based upon the variable previous_day_covid_ED_visits_7_day_sum, defined as “Sum of total number of ED visits who were seen on the previous calendar day who had a visit related to COVID-19 (meets suspected or confirmed definition or presents for COVID diagnostic testing – do not count patients who present for pre-procedure screening) reported in 7-day period.”

The map was based upon the geocodes (longitude and latitude) of each hospital, which were already included in the HHS database. We relied on the Texas A&M interactive geocoding website to fill in the missing geocodes for 18 hospitals. The size of each point was based upon the weighting scheme built into the Stata scatter command. We set the weight of each hospital data point equal to (1 + EDV), so that the 30 hospitals with no ED visits were visible as the smallest points on the map.

The data available from the Florida Department of Health was much less limited in scope at the start of the COVID-19 epidemic. During the spring and summer of 2020, we took advantage of an extensive database of case-by-case reports of COVID-19, posted almost daily by the Department, to study the transmission of the virus from younger, socially mobile individuals to older, less mobile persons. Each line entry in the Department’s database displayed the date of diagnosis, age, gender, county of residence, hospitalization and mortality status of every single confirmed case of COVID-19 to date.

Still, even Florida’s daily databases gave only county-level detail. When we studied COVID-19 transmission in Los Angeles and New York City, the respective health departments reported cases at the individual neighborhood and zip code level. When we studied a COVID-19 outbreak at a university campus in Madison, Wisconsin, we zoomed all the way down to the census tract. County-level reporting simply doesn’t cut it. Our reliance on the geocodes of Florida hospitals fundamentally represents an attempt to get around the geographic coarseness of the Florida data.

U.S. Sentinel Hospitals: COVID-19 Admissions per Emergency Department Visit Continue to Climb

We continue to monitor 250 sentinel hospitals located in 164 counties throughout the U.S. During the week ending December 24, emergency department visits for COVID-19 rose by 38.9%, while hospital admissions rose by 68.7%. There are now 7.5 hospital admissions per 100 ED visits for COVID-19. The evidence does not paint the reassuring picture of generally benign disease.

Fig. 1. Weekly Emergency Department Visits for COVID-19 in a Cohort of 250 Sentinel Hospitals. Our cohort consists of the 250 hospitals with the highest volume of emergency department visits for COVID-19 during the weeks ending June 25 – December 10, 2021. As shown in the map below, these sentinel hospitals are located in 164 counties in 41 states and territories throughout the United States. During each week, for the cohort as a whole, we computed total emergency department visits for COVID-19 and total hospital admissions for COVID-19. The former quantity is plotted above.

Following a Cohort of 250 High-Volume Hospitals

Numerous sources confirm that the incidence of newly diagnosed COVID-19 cases has been rising precipitously in the United States during the past month. The more pressing issue, however, is the composition and severity of those cases.

To address this critical question, we are following a cohort of 250 high-volume hospitals located in 164 counties throughout the U.S. Our focus on a cohort of hospitals known to have treated large numbers of COVID-19 patients avoids problems of sampling variability and inconsistent reporting among smaller, lower-volume hospitals.

ED Visits for COVID-19 Increased by 38.9% During the Past Week.

For this 250-hospital cohort as a whole, we’ve relied on weekly reports from the U.S. Department of Health and Human Services to compute total emergency department visits for COVID-19 and total adult and pediatric hospital admissions for confirmed COVID-19. The admissions data exclude cases of patients who were admitted for other reasons and subsequently found to be infected.

In our 250 sentinel hospital cohort, Fig. 1 above shows that weekly ED visits for COVID-19 increased by 38.9% from 152,885 during the week ending December 17 to 212,383 during the week ending December 24, 2021. ED visits for COVID-19 have now far surpassed the peak of 158,150 reported for the week ending August 20 during the Delta wave.

Hospital Admissions for COVID-19 Have Risen to 7.5 per 100 ED Visits.

Fig. 2. Hospital Admissions for COVID-19 per 100 Emergency Department Visits for COVID-19 in a Cohort of 250 Sentinel Hospitals. Ratio of total adult and pediatric hospital admissions for confirmed COVID-19 to total ED visits for COVID-19, reported by the same cohort of 250 sentinel hospitals described in the caption to Fig. 1.

Within our 250-hospital cohort, admissions for COVID-19 have been rising faster than ED visits. While ED visits rose by 38.9% during the most recent week, hospital admissions rose by 68.7%. As shown in Fig. 2 above, hospital admissions now stand at 7.5 per 100 ED visits. While admissions per 100 ED visits are continuing to rise, Fig. 2 shows that this indicator remains below its peak of 9.9 attained during the week ending August 13.

Tracking hospital admissions per 100 ED visits is obviously a more informative means of assessing Omicron-related case severity than comparing current admission rates to historical controls. Virtually all patients admitted with COVID-19 pneumonia and other acute complications come through the hospital’s emergency department.

Patients who present to the ED with COVID-19 symptoms are a self-triaged population. The symptoms motivating them to seek emergency care now may have changed from those bringing them to the ED last summer. Criteria for admitting patients may also have changed, especially if hospital resources are more constrained, as we have recently reported.

Still, the data in Figs. 1 and 2 hardly communicate the reassuring picture of a generally benign disease. To be sure, the current rate of 7.5 admissions per 100 ED visits is still about 24 percent below the peak of 9.9 during the Delta wave. Only time will tell, however, how high this indicator will continue to rise.

And as many observers have already pointed out, the sheer volume of new cases may be enough to bring our healthcare system to its knees.

Sentinel Hospital Cohort

U.S. continental map showing locations of 249 of the 250 sentinel hospitals in the cohort. Hospital Menonita de Cayey, Cayey, Puerto Rico, not shown. State and county boundaries are indicated.

More U.S. Hospitals Reporting Critical Staff Shortages

After an upswing during the Delta wave, the proportion of U.S. hospitals reporting critical staffing shortages had plateaued at about 19 percent. During the past three weeks, there is growing evidence that critical staffing shortages are again on the rise.

We analyzed all U.S. hospitals reported by the Department of Health and Human Services. (HHS) The data, originally reported on a daily basis, are aggregated by week. The percentages of all reporting hospitals in each state are weighted by their inpatient bed capacity. HHS appears to rely on each hospital’s self-report of a critical staffing shortage.

This post updates an earlier summary of trends in U.S. hospital staffing. During the Delta wave in the United States, the percentage of hospitals reporting critical staffing shortages rose from 12 to 19 percent. Even as hospital admission rates declined in October and November, the critical staffing percentage remained elevated at 19 percent. Over the past three weeks, as the Omicron variant has begun to spread, this percentage has increased to 21.4 percent.

Vaccine Mandates are Unlikely to be the Primary Cause.

Some have contended that vaccine mandates are contributing to the emerging shortage of healthcare workers. But there is little concrete evidence to back up this contention. While a small minority of healthcare employees have chosen to leave their jobs, the vast majority have opted for vaccine protection. At large healthcare systems like Houston Methodist, Truman Medical Centers/University Health in Kansas City, the North Carolina hospital system, Advocate Aurora Health in Chicago, Mount Sinai Health System in New York, St. Claire Regional Medical Center in Kentucky, and Henry Ford Health System in Detroit, less than 1 percent of employees have had to be let go.

The Labor Market for Skilled Nursing Care was Already Tight.

Still others have pointed to the increasing fees charged by traveling nurses and nurse staffing agencies to compensate for growing vacancies among nurse employees. The plain fact, however, is that the tight labor market for hospital-based nursing care predated the COVID-19 pandemic. Annual turnover among hospital-based registered nurses was already up to 15.9% in 2019 and increased to 18.7% in 2020.

It’s All About Pandemic Burnout.

Far and away the most critical determinant of rising staff shortages has been burnout and peritraumatic stress among healthcare workers, with more nurses leaving their employment as the pandemic drags on. While burnout among frontline healthcare workers has always been a serious problem, the percent of surveyed hospitals reporting 10% or more vacancies for RNs abruptly rose from 23.7% in 2019 to 31.8% in 2020 to 35.8% by early 2021.

The evidence of burnout among frontline workers is overwhelming not only in the U.S., but many other healthcare systems, including China during the initial Wuhan outbreak. The president of the American Nurses Association recently asked the U.S. Secretary of Health and Human Services to declare a national nursing shortage crisis. A national strategy to address healthcare worker burnout as been repeatedly urged.

We’re talking about continuous exposure to traumatic stress from extended hours, time away from family, near-continuous use of personal protective equipment, fear of personally contracting COVID-19, loss of patients with whom workers have become emotionally attached, and the rising frequency of medical errors as emergency rooms and ICUs fill up. We’re talking not only about ordinary job burnout, but also compassion burnout.

The anti-vaccination movement is driven in part by conspiracy theories that sow doubt about the integrity of medical professionals. Has the resulting loss of confidence caused some healthcare workers to experience a disconnect from their beliefs in the value of their work?

Stay Tuned.

We will continue to follow the aggregate U.S. hospital staffing situation as the Omicron wave plays out.

Florida COVID-19 Hospital Admissions Now Doubling Every 6.75 Days, Continue to Outpace Earlier Delta Wave

Daily admissions to Florida hospitals for confirmed adult and pediatric cases are now more than twice the count registered at a comparable point during last summer’s Delta wave.

We relied on data from the U.S. Department of Health and Human Services to track combined adult and pediatric hospital admissions for confirmed COVID-19 among all Florida hospitals. The horizontal time axis is measured in days from the estimated first appearance of each variant. See Technical Notes below for details.

We further update our comparison of the hospitalization curves for the Delta and Omicron waves in Florida. By day 15 from the initial appearance of each variant, statewide confirmed COVID-19 admissions among adults and children combined were running at about 250 per day. By day 29, however, Delta-wave admissions were 514, while Omicron-wave admissions have reached 1207. That’s more than twice the number of admissions registered at the same point during this past summer’s wave.

Log-linear regressions on the data points from days 10 to 29 now give doubling times of 20.6 days for Delta and 6.75 days for Omicron. (The 95% confidence interval for the Omicron doubling time is 6.02 – 7.69 days.) As we have repeatedly stressed, these early findings do not necessarily mean that the Omicron curve will reach the Delta peak of 2,360 statewide hospital admissions attained on August 17, 2021 (that is, day 68 from initial appearance).

Hospitalization Rates Matter.

Public officials and some commentators have noted that COVID-19 hospitalization rates are not rising nearly so fast as total case counts. The fact that hospitalization-to-case ratios are now lower than during the past summer’s wave has been highlighted as favorable news. With rapid home-based COVID-19 tests now in abundance, it is unclear what case counts reported by public health departments are supposed to represent.

We continue to focus here on severe disease and its impact on our already stressed healthcare system.

Technical Notes

As we’ve repeatedly noted, we do not have data on the variant underlying each hospital admission. Still, according to the most recent CDC report on state-specific variant proportions, 78.3% of recent SARS-CoV-2 samples sequenced in the U.S. region covering Florida were attributable to the Omicron variant.

We have estimated the initial appearance of the Delta variant as June 10, 2021. There are reports that the variant was in fact detected by late May. If we translated the time axis for Delta to the right, however, the Omicron-related hospitalization curve would be running even further ahead of its predecessor.

The calculations in the figure are derived from COVID-19 Reported Patient Impact and Hospital Capacity by State Timeseries, maintained by the U.S. Department of Health and Human Services. The daily counts represent the daily sums of two variables for all Florida hospitals combined:

  • previous_day_admission_adult_covid_confirmed: Number of patients who were admitted to an adult inpatient bed on the previous calendar day who had confirmed COVID-19 at the time of admission in this state
  • previous_day_admission_pediatric_covid_confirmed: Number of pediatric patients who were admitted to an inpatient bed, including NICU, PICU, newborn, and nursery, on the previous calendar day who had confirmed COVID-19 at the time of admission in this state

Some commentators have expressed a general concern that COVID-19 hospitalization counts include patients admitted for unrelated reasons who incidentally tested positive. Since confirmation of a COVID-19 diagnosis is made by PCR test results that are not immediately available at the time of admission, it is unlikely that the calculations in our figure above suffer from such a potential bias.

If hospitals were backdating COVID-19 diagnoses to the date of admission once they received one- or two-day delayed PCR results, we would detect significant backdating through comparison of serially posted databases.

But we don’t.

The Supreme Court must uphold Biden’s vaccine mandates — and fast

“A dire emergency is not the time to overturn decades of jurisprudence empowering federal agencies to act in the public interest.”

Opinion Column with Lawrence O. Gostin and Dorit Rubinstein Reiss, Washington Post, December 29, 2021

“The Supreme Court needs to uphold the president’s mandates without delay. Not doing so would be an affront to public health and the law.”

“Lower-court rulings that blocked the rules from taking effect were fundamentally flawed.”

“If the high court were to curb federal public health powers now, it could prove ruinous when the next crisis strikes.”

“The Supreme Court has a long history of upholding vaccination mandates, beginning with its seminal 1905 decision upholding smallpox vaccination and continuing with its 1944 ruling on the lawfulness of childhood vaccinations for school entry.”